Dashboard
This page is available only on the old Insights User Interface.
If you are working on the new User Interface, you will not be able to see this page. Please use the Legacy Insights button in the top-right corner of the header to return to the old interface and access this page.
Dashboard Overview
The Dashboard is the first page you will see when you log in to Resolve Insights. Your Dashboard displays the most important information in your network. It provides status, monitoring, and reporting information.
The information on the dashboard is displayed through widgets, either in the form of charts or in tabular format. You can customize the data that is displayed in your Dashboard, by selecting the dashboard layout and selecting specific widgets.
The Dashboard shows the customer specific infrastructure and this may vary based on what resources you have at the cloud data center.
The Dashboards show the overall health of each critical application infrastructure service. You can get the high-level picture of your data center's performance and status. Visualize and optimize the value of application infrastructure resources easily and effectively. Keep track of everything in near real time. Get quick statistics on App Groups, Servers/VMs, Applications, and Critical Events. From here, drill down from the highest cloud data center to the lowest level of troubleshooting detail.
Widgets Overview
The information on dashboards is displayed through widgets. You can combine the available widgets.
Widget Icon Actions
| Icon Name | Description |
|---|---|
| Export | Downloads data displayed in the widget. Click and download the data as CSV to your system. |
| Tooltip | Displays the widget description in tooltip when you hover the mouse over it. |
| Refresh | Refreshes the data on the widget with the most current data. |
| Resize | Allows you to resize the widget. Appears on hover. |
| Remove | Removes the widget from the Dashboard. |
Enabling Auto Refresh Based on Time Interval
You can refresh the Dashboard view based on the selected time interval. To do that, select the time interval from the Interval drop-down list at the top of the screen and flip the Play toggle.
The dashboard view changes between the available dashboards on the selected interval.
Editing Widget Location
You can edit the location of the widgets within the selected layout by dragging and dropping the widgets.
- Hover your mouse on the widget header that you wish to change the location. The mouse pointer will change to a multidirectional arrow.
- Click and drag the widget to the new location.
- Release the mouse button to drop the widget.
The Widget will be moved to the new location.
Adding or Removing Widgets
You can add or remove widgets to customize your dashboard.
- Click Dashboard Widget Settings icon in the Dashboard header.
The Dashboard Management page appears. - Use the widget's toggle switch to determine whether the widget appears on the Dashboard or not:
- Flip the toggle to the right to add the widget to the Dashboard layout.
- Flip the toggle to the left to remove the widget from the Dashboard layout.
- In the confirmation dialog box that appears, click Yes to save the changes to the Dashboard layout.
Available Widgets
Application Service
The Application Service widget displays a summary of all the applications, roles, and services running on compute devices. The data represented in this widget is interactive. Click the graph legend icon to toggle the corresponding data on or off in the graph.
Map
The Map widget displays all the sites, each site's health, and the geographical location of each site on the map. You can also view the map based on device locations.
Hover your mouse on a site to view more details about it.
You can configure the site's coordinates in the map panel. Take these steps:
- Click the settings icon on the map.
The Site Coordinate Settings dialog box appears. - From the Default Region drop-down list, select the required region.
- From the Select Site drop-down list, select the site you want to view.
- In the Search Location field, enter the location name.
- Click Search or enter the location coordinates in the Enter Coordinate field.
- Click Submit.
The new site coordinates are saved and the default region is set to the new region that you selected.
Entities Status
The Entities Status widget displays the vCenter entries by their traffic light status (green-yellow-red), grouped by type.
Entities Classification
The Entities Classification widget displays the number of vCenter entities under the various classifications - Host vendors, vCenter version, OS type, and others.
Devices By Configuration
The Devices By Configuration widget displays top 10, top 20, or top 30 devices by configuration in the category of CPU, memory, and disk.
Host CPU And Memory
The Host CPU And Memory widget displays each VM host's free and used CPU and memory. You can choose to view the data in capacity or percentage metrics.
Datastore Capacity
The Datastore Capacity widget displays each datastore's free and used space. You can choose to view the data in capacity or percentage metrics.
Phrases Map
The Phrases Map widget displays the number of VM devices per predefined phrase criteria.
Filtering by Device Group and Category
You can filter the information displayed in the Dashboard by device Group and Category and visualize only the data for a specific device group or category. A device group is a number of devices grouped together in accordance with your specific business needs. Device groups can in turn be combined into device group categories for an even more detailed overview of your system.
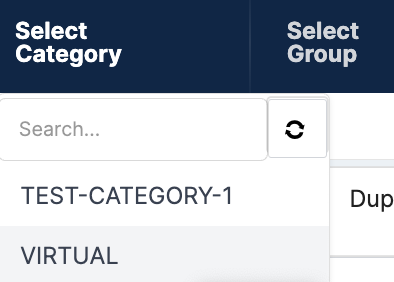
To filter by device group or category, in the upper Main Menu bar, hover your mouse pointer over Select Group or Select Category and click the one by which you want to filter.

For example, if you select a specific category, the view will only show information about the devices included in the device groups associated with this category, in this case "Virtual".
To return to viewing all devices again, go to another Insights view, such as Inventory, and then return to Dashboard.
The filters are only visible if there are existing Device Groups and Categories in your Insights instance.
The Device Groups and Categories drop-down lists are independent. Device Groups always lists all existing groups regardless of your selection in Categories.
You can only filter by one category or one group at a time. If a category is selected and you then select a group, the category filter will be cleared and the results will be filtered by the selected group, and vice versa.